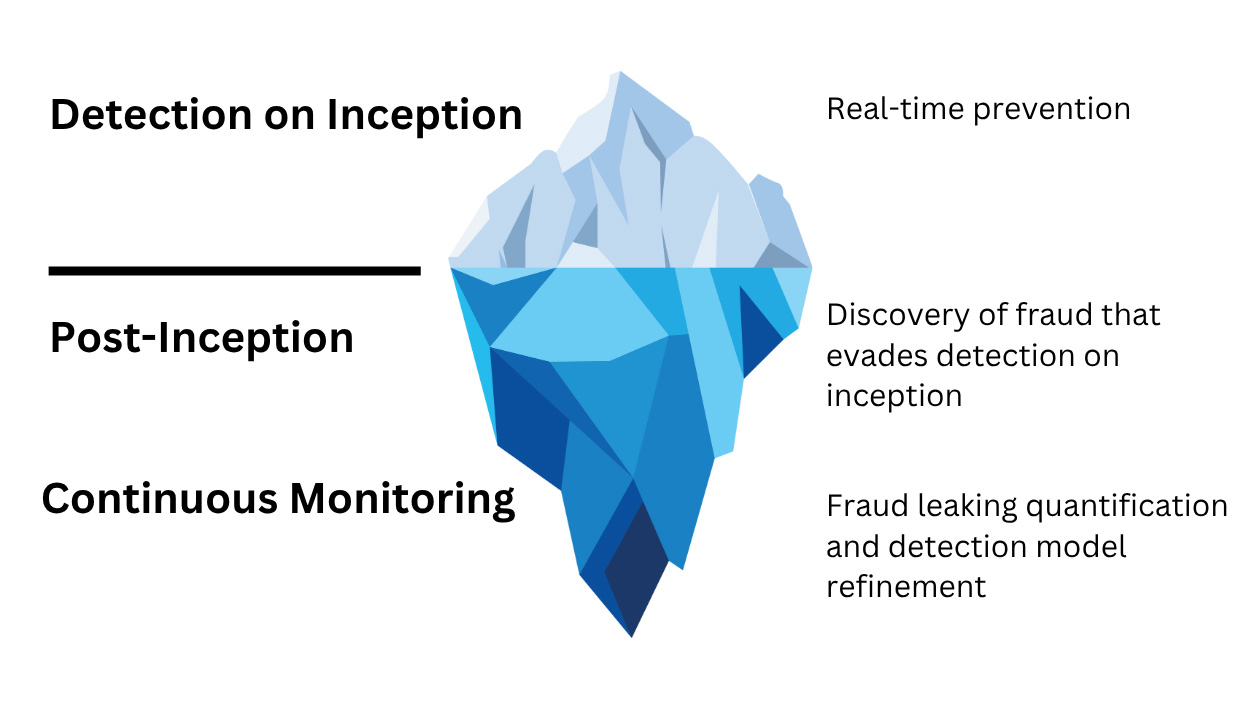
For every piece of insurance fraud detected, it’s estimated that the same amount goes undetected. This is where the dangerous fraud and organised crime lies.
Post-Inception Fraud Detection focusses on emerging fraud signals, policyholder behaviour over time, or suspicious claims patterns.
Continuous Monitoring focusses on model tuning, fraud leakage quantifications and identifying missed frauds.
This is where GRAPHT comes in.
Dashboards can identify trends but lack the detail to identify actual fraud. While Network visualisation has been proven to detect by visualising behaviour and patterns as networks.
Legacy network visualisation products have always been limited in scale. This means that intelligence/investigation teams must concentrate on small time series or known fraudulent patterns, by writing queries to narrow down to a manageable size. But what if the fraudulent pattern is not known?
Take a large insurance company who might process over 350,000 claims annually. They could process in excess of 7,000 claims a week.1
Now let’s assume that each claim has data points linked to it, the claimant, an address, email, phone number, maybe a vehicle. Each claim + its linked data points could generate 70,000 items to visualise, considerably more than what the current legacy products can visualise.
What if you want to analyse more than a weeks worth of data?